It’s been nearly a year since my last article, and I’m finally publishing a new one! During the 2016 Dragon Boat Festival holiday, I’m sure many friends from Taipei will choose Yilan as their first destination. Whether you drive or take a bus, if you go through the Xueshan Tunnel on National Freeway No. 5, it takes only about 40 minutes to reach Yilan if all goes well. Of course, everyone knows that during a holiday like this, things are rarely that smooth… Today I’m going to analyze the traffic patterns of the Xueshan Tunnel so you can avoid the crowds and get to Yilan smoothly! Below there will be a short technical explanation and the analysis process; if you’re not technically inclined, you can jump straight to the conclusion! By the way, I’m in Yilan today, and this article was actually written at the Brown Cafe Castle.
Conclusion
Speaking to the point is important in writing, so let's start with the conclusion!The best way to avoid traffic is to avoid holidays. As the analysis below shows, there are simply too few roads leading to Yilan. You don’t need a four-day holiday like this one. Even on a normal weekend, the Xueshan Tunnel gets jammed solid, and even if you make it through the tunnel, you still have to worry about traffic in town and a shortage of parking.
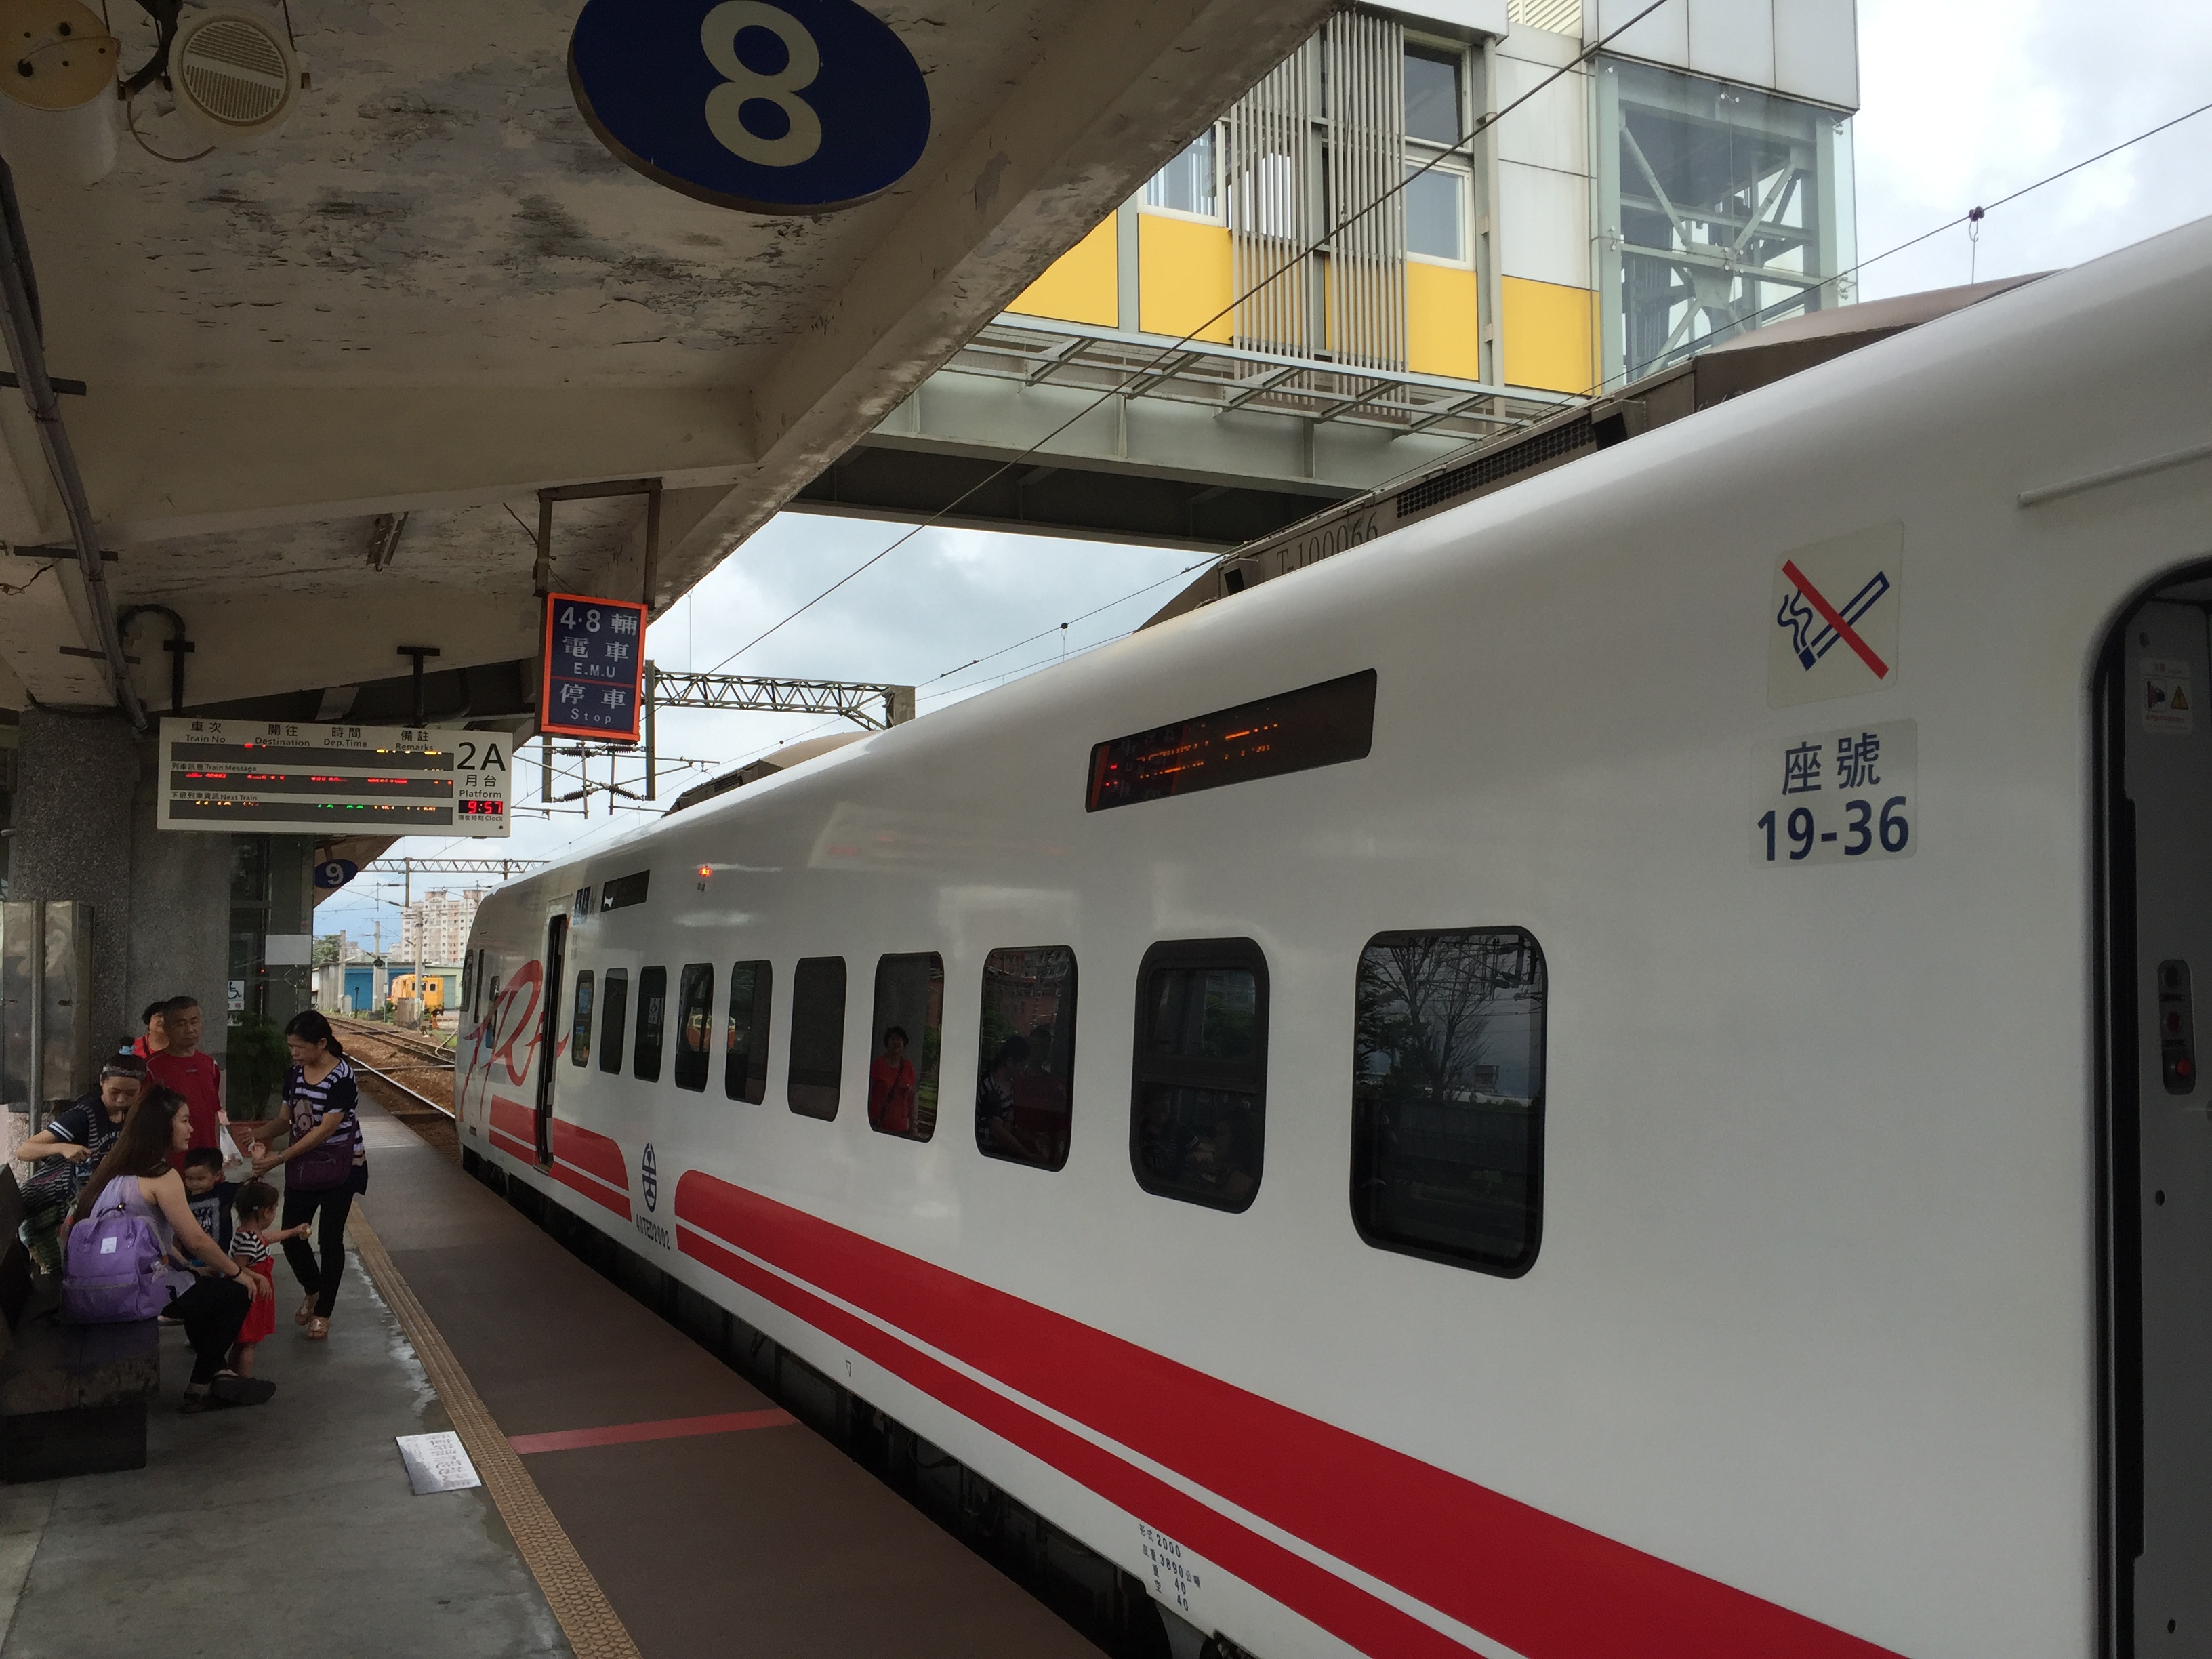
On weekends or consecutive holidays, the train is definitely the best choice. Today I took the Puyuma Express straight to Yilan (I bought the ticket only yesterday). It took about an hour, roughly the same as the bus, but there was absolutely no traffic!
If you think there are too few trains, buses are also a good option. At least when traffic jams happen, you’re not the one driving, so you can just lie back and sleep. But note that I don’t recommend taking a bus in the morning (lol). Afternoons and late nights are the best times. Most people think leaving early will help them avoid traffic, but the analysis below shows that the traffic peaks around 10 a.m. and noon, and then gradually decreases in the afternoon.
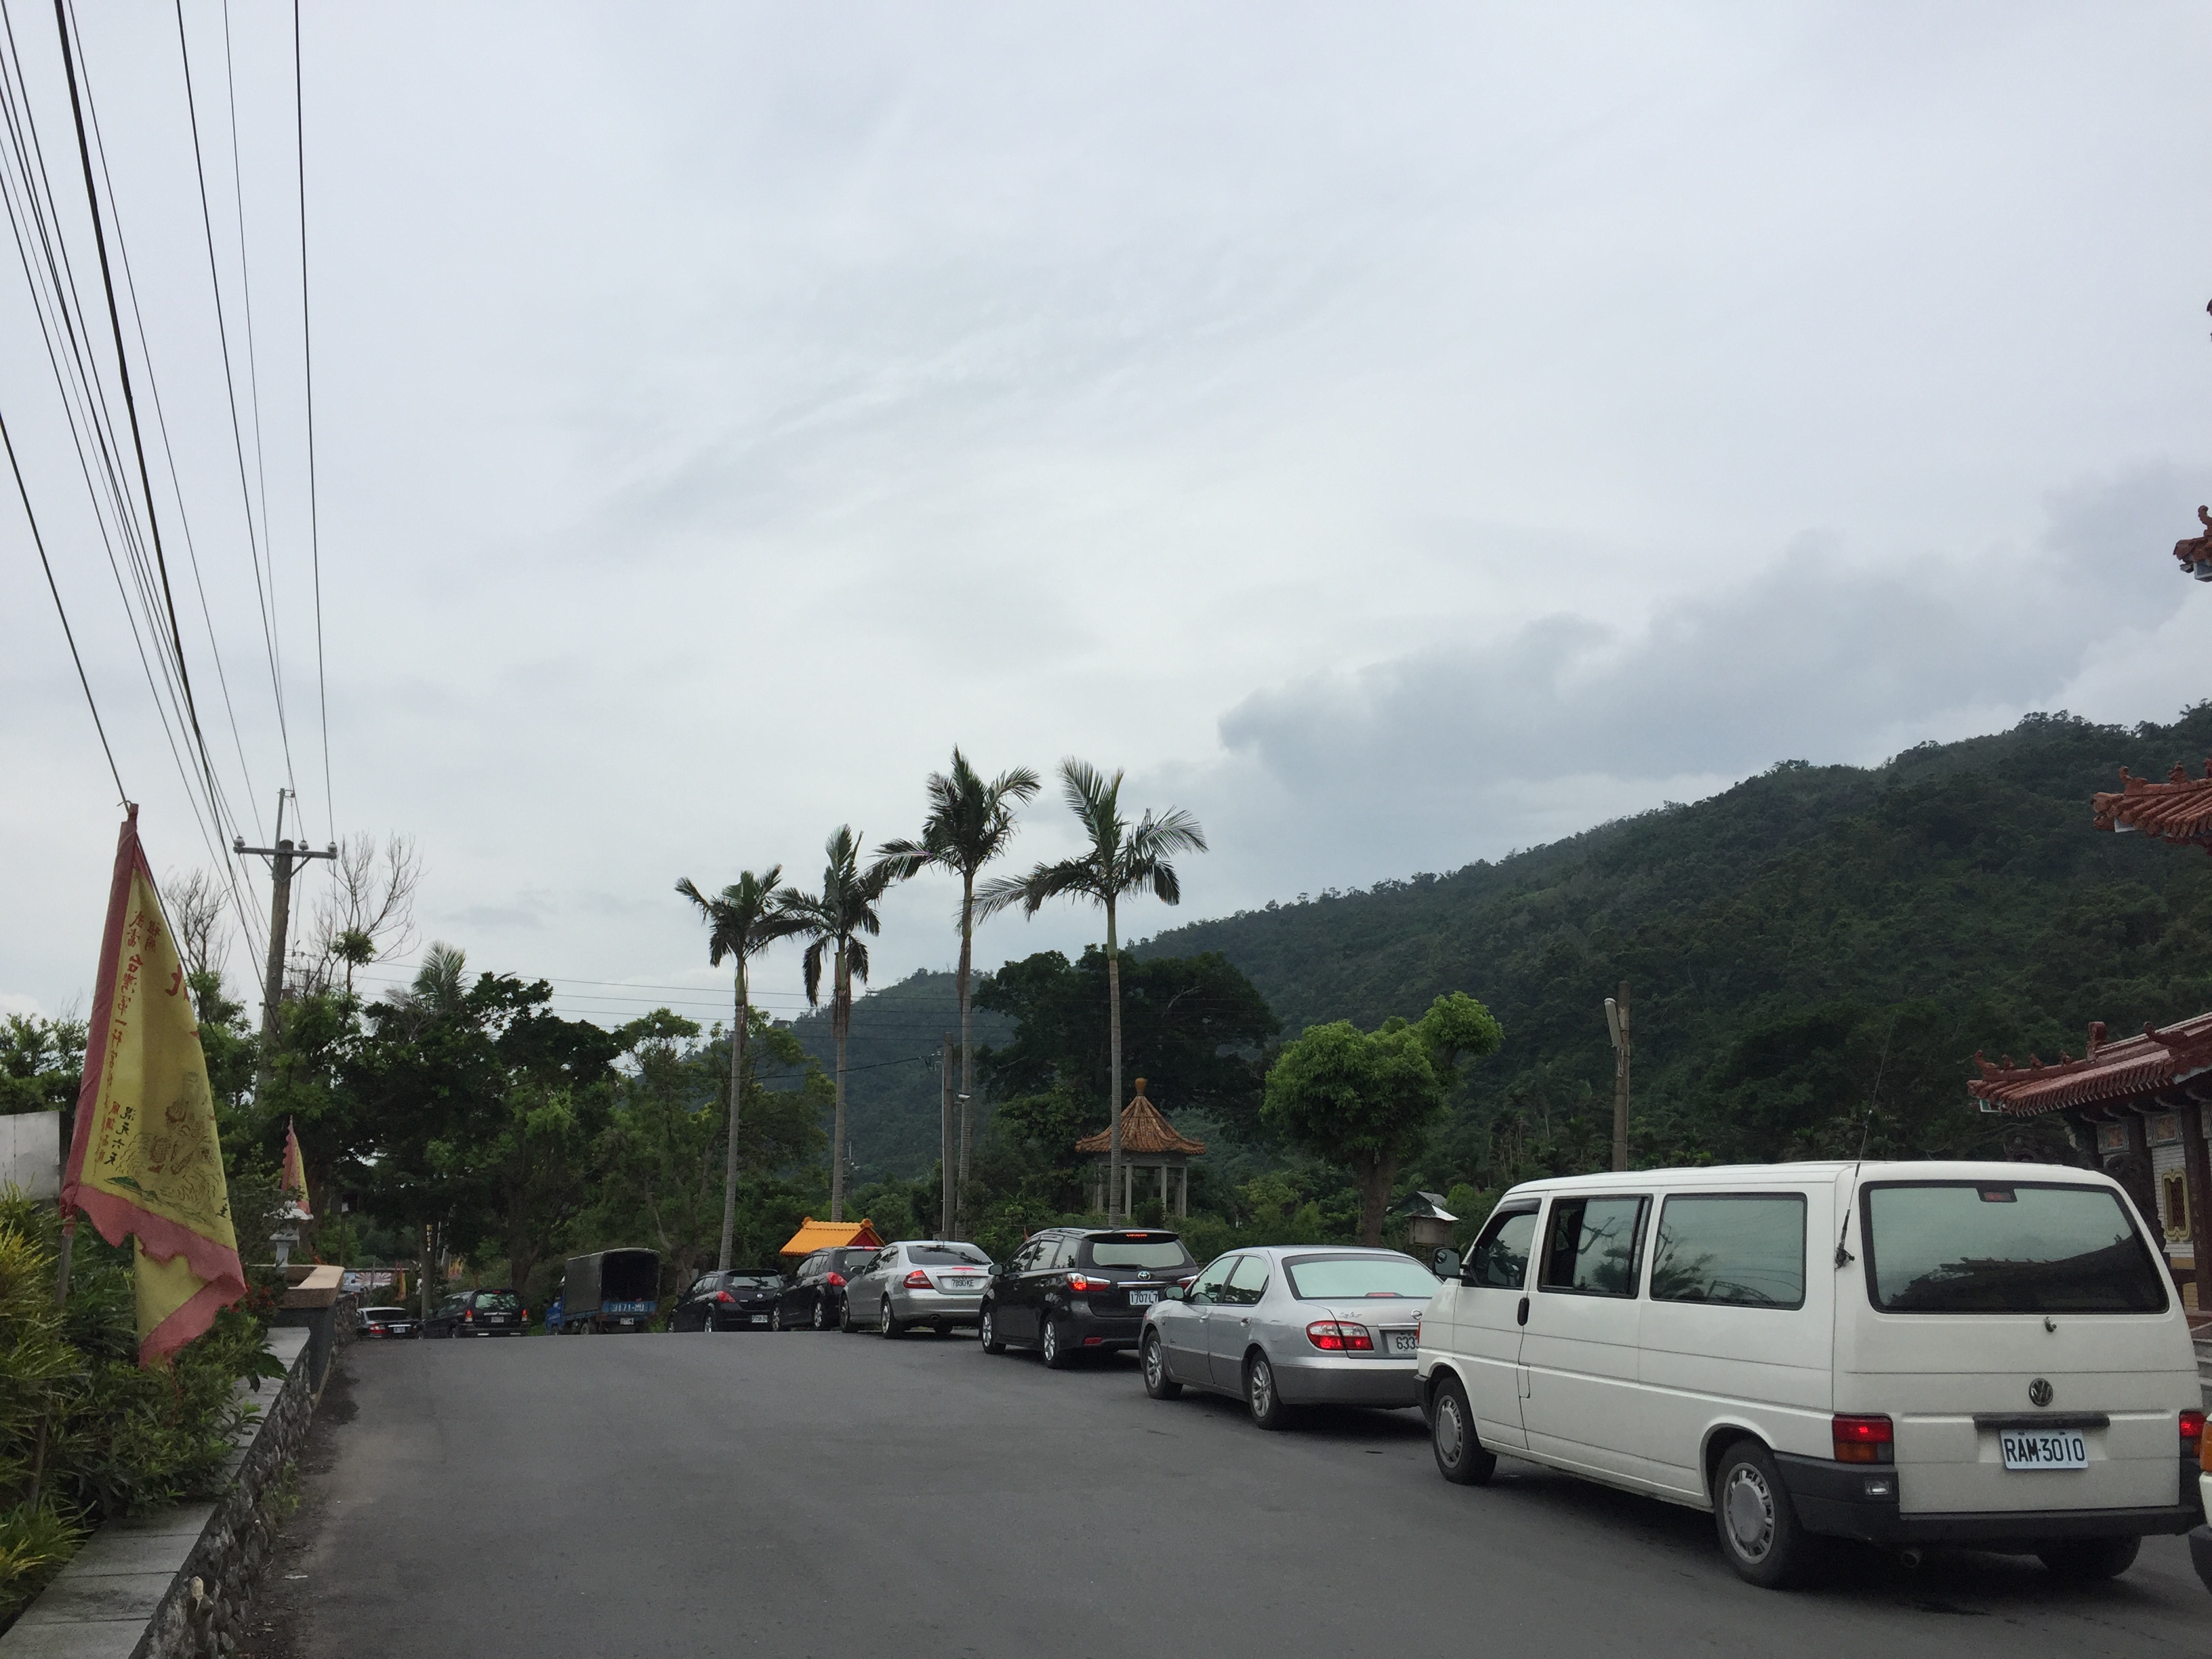
Also, once you arrive in Yilan, don’t rent a car. Rent a scooter instead, because otherwise finding parking will be a nightmare all day. This is my honest impression from riding around this morning: I saw all the cars stuck at the entrances of the parking lots, and I couldn’t help feeling glad I hadn’t rented a car, hehehe.
Technical Notes
That wraps up the conclusion, so now for the technical part. The following report is based on the ETC data for highways provided by the National Freeway Bureau of the Ministry of Transportation and Communications (highway ETC data). If you have a technical background, you can refer to this explanation and analyze the traffic volume data for other road sections yourself.First, I used the M03A traffic volume statistics dataset. It contains the number of vehicles passing each ETC detection station every five minutes, from January 1, 2014 to the present, along with the types of vehicles that passed. It’s the best dataset for analyzing congestion on highways.
- Raw data download: http://tisvcloud.freeway.gov.tw/history/TDCS/
- Dataset documentation: https://ntust.me/2vdn5
- Data processing script: https://ntust.me/gpv6t
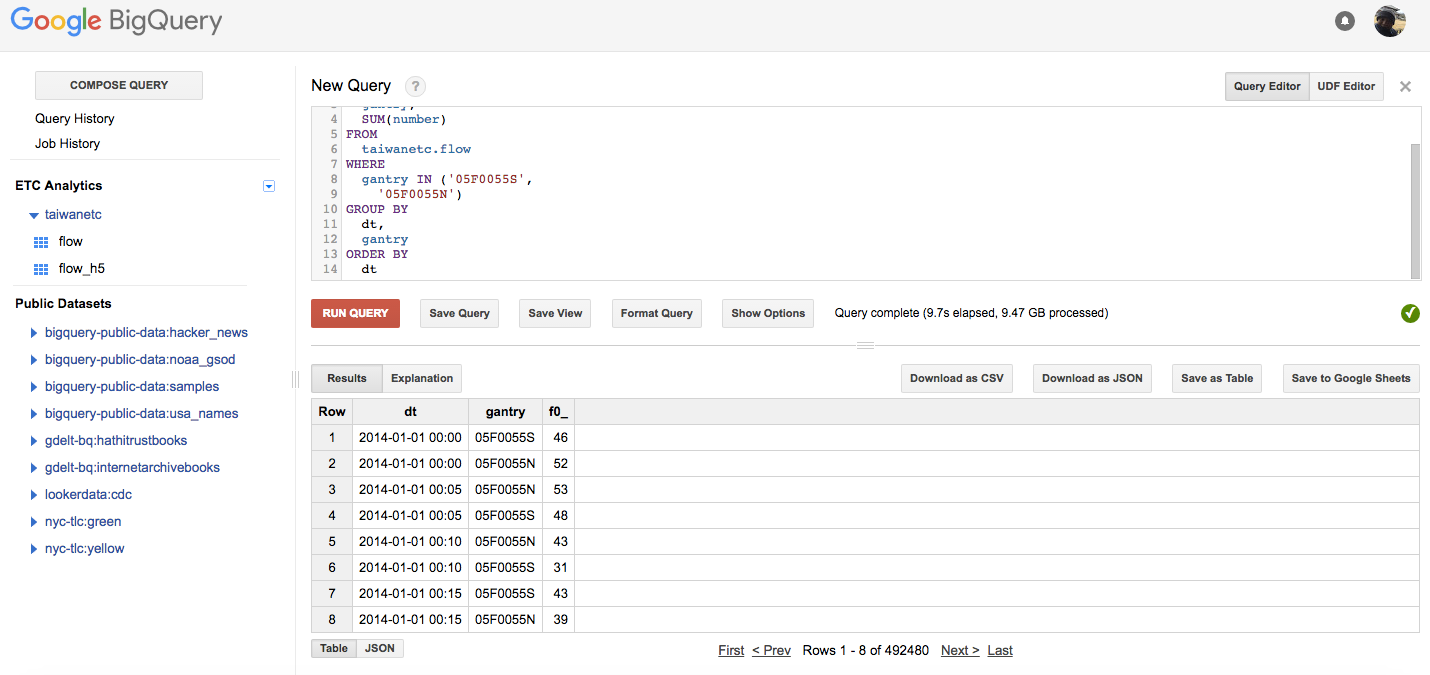
Because the dataset is split across many files, I wrote a Python script to organize the data. After organizing it, I uploaded it to Google Cloud Storage with gsutil, then used BigQuery to read the data directly from Cloud Storage and create a table. Next, I used SQL to pull out the data I was interested in, moved it into Google Sheets for further processing, and finally plotted the charts with Plotly.
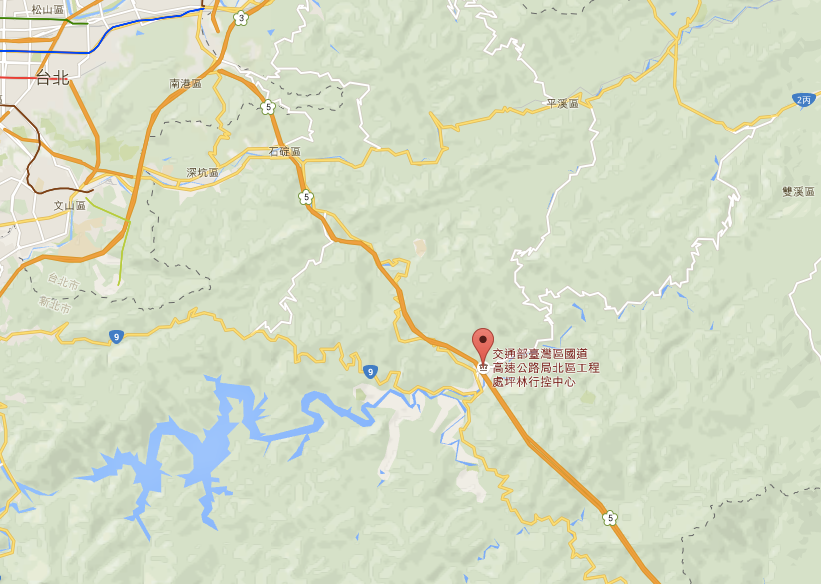
The following analysis uses data from two monitoring stations, 05F0055S and 05F0055N. These two stations are at the entrance to the Xueshan Tunnel on the Taipei-to-Yilan route, and they represent southbound and northbound traffic, respectively. The time range is January 1, 2014 to May 1, 2016.
Criteria for Determining Traffic Jams
With the highway ETC data, I can easily find the traffic volume per hour, per day, or per week. But a question remains: "How much traffic does it take to cause a jam?" A traffic volume on its own is just a string of numbers. Here I use a low threshold, an average, and a high threshold to decide whether a jam is happening. The results are as follows:Southbound (daily)
- Low threshold: 25,100 vehicles
- Average: 28,213 vehicles
- High threshold: 34,209 vehicles
- Low threshold: 25,667 vehicles
- Average: 28,542 vehicles
- High threshold: 33,950 vehicles
General Trend Analysis
Here I use days as the unit, combined with the low, average, and high thresholds from before, and I make good use of the conditional formatting tool in Google Sheets. We can see that on every holiday weekend, the traffic in both directions is almost always around the high threshold.The chart below shows the traffic from Yilan to Taipei. For the complete data, click this link.
You’ll notice that traffic surges on Sundays and Mondays, while Saturday traffic is comparatively light. Weekday traffic is almost always below the low threshold.
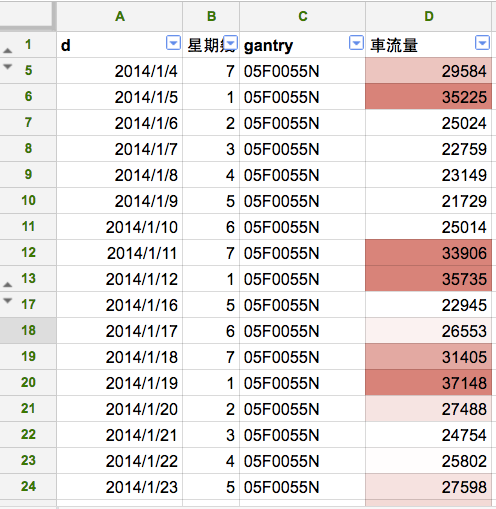
The chart below shows the traffic from Taipei to Yilan. In contrast to the northbound direction, the hot spots are mostly concentrated on Saturdays and Sundays.
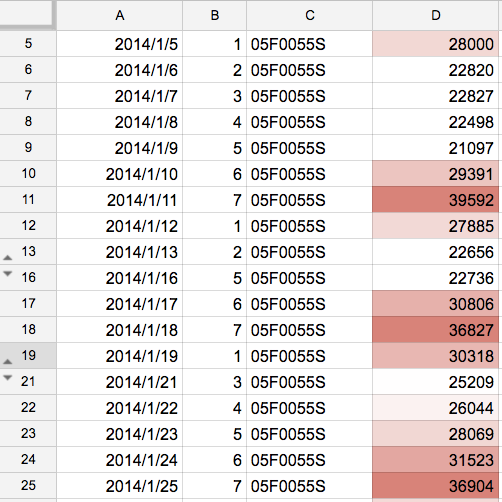
From these two charts, we can reasonably guess that most people go to Yilan on Saturday and return to Taipei on Sunday or Monday for work.
Here is more detailed chart data as well. It covers Monday through Friday, with hourly intervals. This data was plotted with Plotly, and you can click or select with the mouse to see the details.
Southbound
Northbound
Single-Day Analysis
Here I use single days as the range and hours as the interval, so you can see what time it's best to leave if you really are going to drive or take a bus. Of course, you can also work with the raw data directly, since the situation can be quite different from Monday to Sunday.Southbound
Northbound
Beyond the analysis directions above, there are many other angles to try, such as how traffic changes during three-day or four-day holidays, or even how the weather factors in. Different detection stations may also show different patterns. If you’re interested, grab your keyboard and get started! Maybe I’ll write a detailed technical explanation next time, when I have the chance.